How to copy SQL Server data to Elasticsearch using LogStash
19 Mar 2018
As a developer working with SQL Server there was a need to import data from the database to Elasticsearch and analyze data in Kibana.
As Elasticsearch is an open source project built with Java and handles mostly other open source projects, documentations on importing data from SQL Server to ES using LogStash.
I'd like to share how to import SQL Server data to Elasticsearch (version 6.2) using LS and verify the result on Kibana.
Assumption
I will skip on installing ELK (ElasticSearch, LogStash, and Kibana) stack as it's outside the scope of this article.
Please refer to installation steps on Elastic download pages.
Overview
Here are the steps required to import SQL Server data to Elasticsearch.
- Install Java Development Kit (JDK)
- Install JDBC Driver for SQL Server
- Set CLASSPATH for the driver
- Create an Elasticsearch Index to Import Data to
- Configure LogStash configuration file
- Run LogStash
- Verify in Kibana
Before we go any further, have you seen this course on Pluralsight? Getting Started With Elasticsearch for .NET Developers
Step 1 - Install Java SE Development Kit 8
One of the gotchas is that you might install the latest version of JDK, which is version 9 but Elasticsearch documentation requires you to install JDK 8.
At the time of writing, the latest JDK 8 version is 8u162, which can be downloaded here.
Download "JDK8 8u162" and install it on your machine and make sure that "java" is in the PATH variable so that it can be called in any directory within a command line.
Step 2 - Install JDBC Driver for SQL Server
You need to download and install Microsoft JDBC Driver 4.2 for SQL Server, not the latest version.
As Elasticsearch is built with JDK 8, you can't use the latest version of JDBC Driver (version 6.2) for SQL Server as it does not support JDK 8.
Step 3 - Set CLASSPATH for the JDBC Driver
We need to set the path so that Java can find the JDBC driver.
📝 Note: I am working on Windows 10 machine.
1. Go to the directory under which you have installed SQL Server JDBC.
2. Now you need to navigate to find a JAR file named sqljdbc42.jar, which is found under <<JDBC installation folder>>\sqljdbc_4.2\enu\jre8.
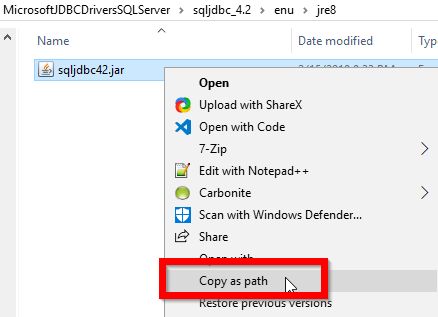
3. And then copy the full path to the JAR file.
A cool trick on Windows 7/8/10 is that, when shift+right click on a file, it gives you a "Copy as Path" option.
4. Go to Windows Start button and type "environment" and click on "Edit the system environment variables".
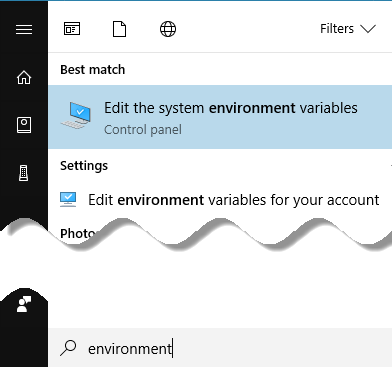
5. Add a CLASSPATH environment variable with following values (if you don’t already have one).
- “.” - for the current directory to search.
- And the JAR file path copied in previously (e.g. "C:\misc\Java\MicrosoftJDBCDriversSQLServer\sqljdbc_4.2\enu\jre8\sqljdbc42.jar").
Gotcha: If you have a space in the path for JDBC JAR file, make sure to put double quotes around it.
.;"C:\misc\Java\Microsoft JDBC Drivers SQL Server\sqljdbc_4.2\enu\jre8\sqljdbc42.jar"
Not doing so will result in either of following error messages when you start LogStash service in later step.
c:\misc\elasticco\logstash-6.2.2>bin\logstash -f sql.conf

Error: Could not find or load main class JDBC

 - Or -

c:\misc\elasticco\logstash-6.2.2>bin\logstash -f sql.conf

Error: Could not find or load main class File\Microsoft
Let's now move onto to create an Elasticsearch index to import data to.
Step 4 - Create an Elasticsearch Index to Import Data to
You can use cURL or Postman to create an Index but I will use Kibana console to create an index named "cs_users", which is equivalent to a database in relational database terminology.
Before we start the Kibana service, we need to start Elasticsearch so that Kibana would not whine about Elasticsearch not being present.
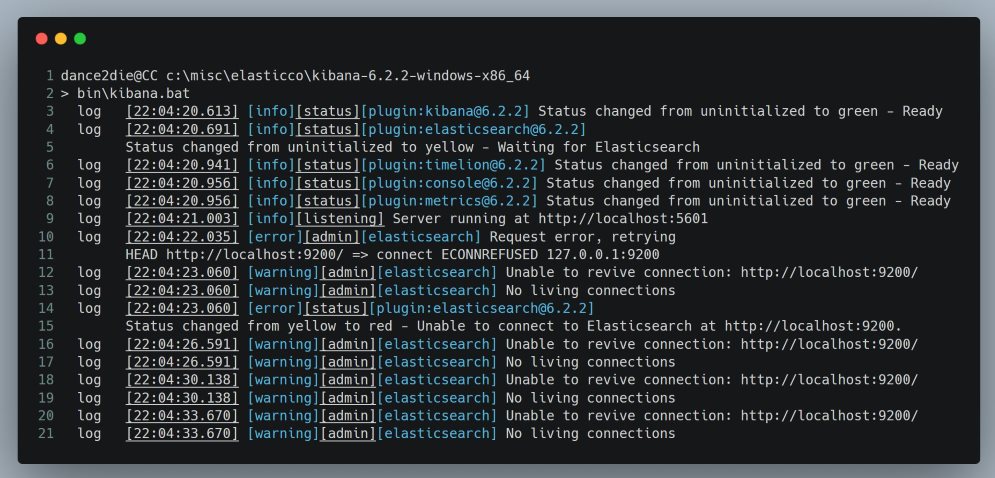
Kibana warnings on lines 12~21 due to Elasticsearch being unavailable
Go to the Elasticsearch installation and start the service.
dance2die@CC c:\misc\elasticco\elasticsearch-6.2.2
> bin\elasticsearch.bat
And then go to the Kibana installation directory to start Kibana service.
dance2die@CC c:\misc\elasticco\kibana-6.2.2-windows-x86_64
> bin\kibana.bat
If Kibana started without an issue, you will see an output similar to the following.

Kibana started successfully
On line 9, Kibana reports that it is running on http://localhost:5601.
Open the URL in a browser of your choice.
Now go to "Dev Tools" link on the bottom left of the page.
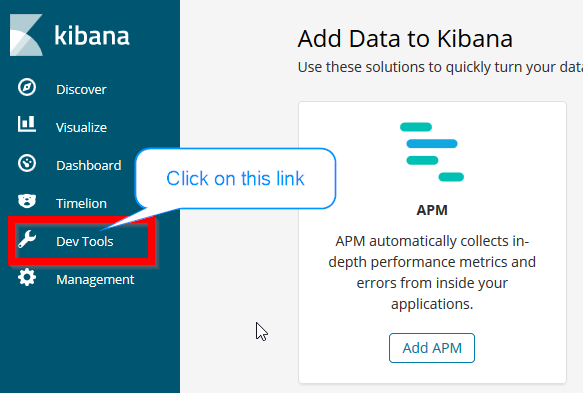
Click on Kibana Dev Tools Link
Once you see the Console, create a new index with the following command.
PUT cs_users
{
        "settings" : {
              "index" : {
                      "number_of_shards" : 3,
                      "number_of_replicas" : 0
              }
        }
}
on the left panel of the Kibana Dev Tools Console.
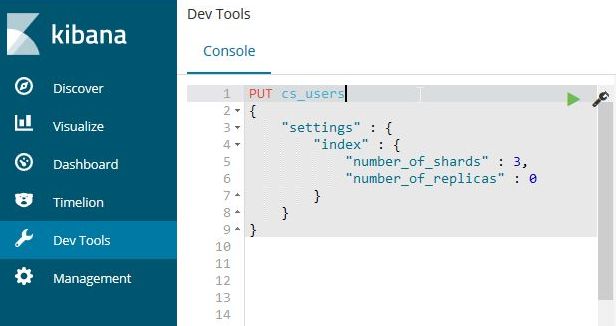
Create a new Elasticsearch index named "cs_users"
I won't go into details on "shards" and "replicas" since it’s outside the scope of this article. For more information on the syntax, refer to the official Elasticsearch documentation.
And you will see the response from Elasticsearch with index creation confirmation on the panel right.

A new index "cs_users" is created on Elasticsearch successfully
OK, now we are finally ready to move onto creating a configuration file for LogStash to actually import data.
Step 5 - Configure LogStash configuration file
Go to the LogStash installation folder and create a file named "sql.conf" (name doesn't really matter).
Here is the LogStash configuration I will be using.
input {
  jdbc {
    jdbc_connection_string => "jdbc:sqlserver://cc:1433;databaseName=StackExchangeCS;integratedSecurity=true;"
    jdbc_driver_class => "com.microsoft.sqlserver.jdbc.SQLServerDriver"
    jdbc_user => "xxx"

    statement => "SELECT * FROM Users"
  }
}

output {
  elasticsearch {
    hosts => ["localhost:9200"]
    index => "cs_users"
  }
}
Let me break down “input” and “output” configurations.
Input
There are three required fields you need to specify for "jdbc" input plugin.
jdbc_connection_string - This field instructs LogStash information on SQL Server.
"jdbc:sqlserver://cc:1433;databaseName=StackExchangeCS;integratedSecurity=true;"
Elasticsearch will connect to the server named "cc" running on port 1433 to connect to database named "StackExchangeCS" with integrated security authentication method.
📝 Note: StackExchangeCS is a database containing StackExchange records for cs.stackexchange.com, which I imported using an app here. And the data dump can be found here.
You’d need to adjust the connection string by referring to following Microsoft documentation.
jdbc_driver_class - This is the driver class contained within the JDBC JAR file.
The JDBC JAR file contains a driver of type "com.microsoft.sqlserver.jdbc.SQLServerDriver" according to the documentation.
If you have an inquisitive mind, you can confirm it by opening the JAR file with your choice of ZIP program as JAR is a simple ZIP file.
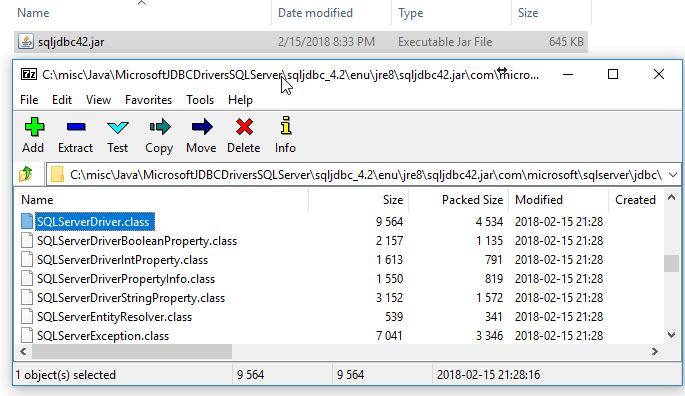
Unzip JAR to verify JDBC driver name
jdbc_user - If you are using "Integrated Security" as an authentication option, this can be any string (I just entered “xxx” since that’s the easiest thing I can type 😉).
Output
output {
  elasticsearch {
    hosts => ["localhost:9200"]
    index => "cs_users"
  }
}
SQL Server data (all cs.stackexchange.com users) will be sent to Elasticsearch running on the local machine port 9200 and will be indexed under "cs_users" index created in “Step 4 - Create an Elasticsearch Index to Import Data to”.
There are quite a bit of Elasticsearch configuration options so please refer to the official LogStash documentation for more "elasticsearch" output plugin options.
Step 6 - Import Data with LogStash
With prerequisites out of the way, we are now ready to import data to Elasticsearch from SQL Server.
Go to the LogStash installation location under which you should have created "sql.conf" and run LogStash service.
bin\logstash -f sql.conf
-f flag specifies the configuration file to use.
In our case, "sql.conf" we created in the previous step.
The result of successful LogStash run will look similar to following output.
dance2die@CC c:\misc\elasticco\logstash-6.2.2
> bin\logstash -f sql.conf
Sending Logstash's logs to c:/misc/elasticco/logstash-6.2.2/logs which is now configured via log4j2.properties
[2018-03-17T18:20:37,537][INFO ][logstash.modules.scaffold] Initializing module {:module_name=>"fb_apache", :directory=>"c:/misc/elasticco/logstash-6.2.2/modules/fb_apache/configuration"}
[2018-03-17T18:20:37,568][INFO ][logstash.modules.scaffold] Initializing module {:module_name=>"netflow", :directory=>"c:/misc/elasticco/logstash-6.2.2/modules/netflow/configuration"}
[2018-03-17T18:20:37,990][WARN ][logstash.config.source.multilocal] Ignoring the 'pipelines.yml' file because modules or command line options are specified
[2018-03-17T18:20:39,100][INFO ][logstash.runner ] Starting Logstash {"logstash.version"=>"6.2.2"}
[2018-03-17T18:20:39,975][INFO ][logstash.agent ] Successfully started Logstash API endpoint {:port=>9600}
[2018-03-17T18:20:44,584][INFO ][logstash.pipeline ] Starting pipeline {:pipeline_id=>"main", "pipeline.workers"=>4, "pipeline.batch.size"=>125, "pipeline.batch.delay"=>50}
[2018-03-17T18:20:45,440][INFO ][logstash.outputs.elasticsearch] Elasticsearch pool URLs updated {:changes=>{:removed=>[], :added=>[http://localhost:9200/]}}
[2018-03-17T18:20:45,456][INFO ][logstash.outputs.elasticsearch] Running health check to see if an Elasticsearch connection is working {:healthcheck_url=>http://localhost:9200/, :path=>"/"}
[2018-03-17T18:20:45,815][WARN ][logstash.outputs.elasticsearch] Restored connection to ES instance {:url=>"
[2018-03-17T18:20:45,971][INFO ][logstash.outputs.elasticsearch] ES Output version determined {:es_version=>nil}
[2018-03-17T18:20:45,987][WARN ][logstash.outputs.elasticsearch] Detected a 6.x and above cluster: the `type` event field won't be used to determine the document _type {:es_version=>6}
[2018-03-17T18:20:46,002][INFO ][logstash.outputs.elasticsearch] Using mapping template from {:path=>nil}
[2018-03-17T18:20:46,049][INFO ][logstash.outputs.elasticsearch] Attempting to install template {:manage_template=>{"template"=>"logstash-*", "version"=>60001, "settings"=>{"index.refresh_interval"=>"5s"}, "mappings"=>{"_default_"=>{"dynamic_templates"=>[{"message_field"=>{"path_match"=>"message", "match_mapping_type"=>"string", "mapping"=>{"type"=>"text", "norms"=>false}}}, {"string_fields"=>{"match"=>"*", "match_mapping_type"=>"string", "mapping"=>{"type"=>"text", "norms"=>false, "fields"=>{"keyword"=>{"type"=>"keyword", "ignore_above"=>256}}}}}], "properties"=>{"@timestamp"=>{"type"=>"date"}, "@version"=>{"type"=>"keyword"}, "geoip"=>{"dynamic"=>true, "properties"=>{"ip"=>{"type"=>"ip"}, "location"=>{"type"=>"geo_point"}, "latitude"=>{"type"=>"half_float"}, "longitude"=>{"type"=>"half_float"}}}}}}}}
[2018-03-17T18:20:46,143][INFO ][logstash.outputs.elasticsearch] New Elasticsearch output {:class=>"LogStash::Outputs::ElasticSearch", :hosts=>["//localhost:9200"]}
[2018-03-17T18:20:46,924][INFO ][logstash.pipeline ] Pipeline started succesfully {:pipeline_id=>"main", :thread=>"#"}
[2018-03-17T18:20:47,174][INFO ][logstash.agent ] Pipelines running {:count=>1, :pipelines=>["main"]} [2018-03-17T18:20:48,956][INFO ][logstash.inputs.jdbc ] (0.062000s) SELECT * FROM Users
[2018-03-17T18:21:19,117][INFO ][logstash.pipeline ] Pipeline has terminated {:pipeline_id=>"main", :thread=>"#"}
Step 7 - Verify in Kibana
Wow, we have finally imported data. Now let's do a quick check whether the number of records in the database matches the records in Elasticsearch.
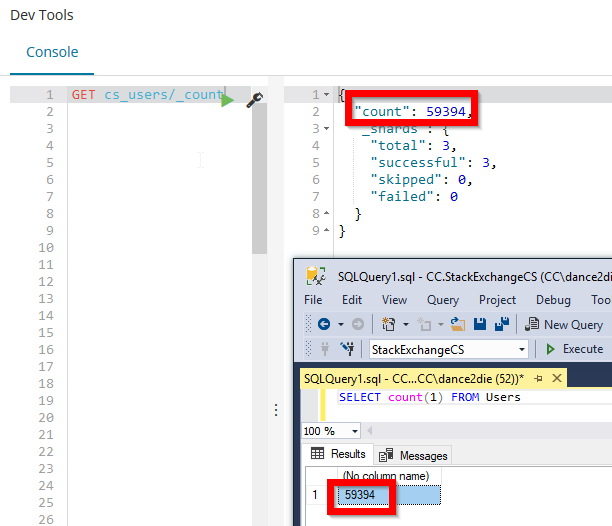
Verifying result of data import
"User" table in the SQL Server has 59394 records and Elasticsearch returns the same number as well.
📝 Note: You can use following command to get the list of all records in "cs_users" index.
GET cs_users/_count
For more information on how “_count” works, refer to Count API documentation.
Conclusion
Congratulations for getting this far 👏👏👏.
As a .NET developer, I've had quite a trouble importing SQL Server data to Elasticsearch at work.
I hope the article shows you a configuration options to get started with as well as resources for configuration options.
I confess that I tried to stay on the Happy Path to make the example easier to digest because ELK stack has so many configuration options so it's nearly impossible to write a post to handle every possible options.


